Measuring CI budgets with Guix and Grafana before setting quotas
How I used Guix System services, cgroup v2 and a Grafana dashboard to measure Cuirass and Forgejo runner workloads on Emma without imposing limits yet.

Emma does several jobs for me. It runs Cuirass for Guix builds and a Forgejo Actions runner, and I would like to add more services without discovering too late that CI ate the machine. My first instinct was to give each workload a quota: 11 GiB and four CPU cores for builds, 2 GiB and one core for the runner. Those are useful planning numbers, but applying them before measuring the jobs would have been guesswork.
So this is the measurement stage of setting a quota. The numbers appear as lines in Grafana; they are not memory.max, memory.high or cpu.max. A graph can show that a workload crossed a line without throttling or killing it. I will only consider limits after watching real, overlapping jobs, checking the host's spare capacity and comparing CI completion times.
Guix owns the layout
Emma runs Guix System, so I put the plumbing in its machines/emma/system.scm configuration rather than relying on a script somebody has to remember to rerun after a reboot. A one-shot Shepherd service prepares these cgroup-v2 paths:
/sys/fs/cgroup/emma/
├── ci-builds/
│   ├── cuirass/
│   └── guix-daemon/
└── emma-runner/
    ├── runner/
    └── podman/
Its Python helper, workload_cgroups.py, checks that the cpu, memory and io controllers are available, enables them on the parents and creates the leaves. It is idempotent and refuses to proceed if the required controllers are missing. The Cuirass and Guix-daemon leaves stay root-owned; only the runner's own leaves are delegated to its service account. PostgreSQL and host-management processes do not belong to either workload.
In Scheme, the dependency is explicit. The service graph requires the layout before the daemons can be started:
(define %emma-cgroup-layout
  (shepherd-service
    (provision '(emma-cgroup-layout))
    (requirement '(user-processes cgroups2-fs-owner
                   file-system-/sys/fs/cgroup))
    (one-shot? #t)
    (start #~(make-forkexec-constructor
               (list #$(file-append python "/bin/python3")
                     #$(local-file "workload_cgroups.py"))))
    (stop #~(make-kill-destructor))))

(simple-service 'emma-cgroup-layout
                shepherd-root-service-type
                (list %emma-cgroup-layout))
That local-file matters. The helper becomes part of the system build, tied to the configuration generation. The service definitions and the private Guix channel supplying the launchers are versioned together. A deployment can be built and checked before switching the running host, and the previous system generation remains a separate rollback path from Git.
Put processes in the group before they drop privileges
Creating a cgroup is easy. Accounting for the actual descendants is harder. Moving a running service supervisor into a group later can miss children it has already launched. The Guix channel therefore supplies a cgroup-launch-overlay: a file-like package tree that preserves the original package but replaces one executable with an exec-in-place launcher. The launcher writes its own PID to the leaf's cgroup.procs, drops to the normal service account where needed, then executes the original daemon. If placement fails, the service does not silently run outside accounting.
This ordering caught a real bug in the first draft. The normal Cuirass Shepherd start dropped to cuirass before my wrapper tried to enter its root-owned leaf. It failed with Permission denied. I adapted the Cuirass service type's two Shepherd starts instead, keeping the upstream account, activation sockets and other service extensions while entering the group as root and switching back to cuirass before executing the daemon. The shared Guix daemon has its own leaf because builds it starts cannot honestly be counted as Cuirass-only work.
The Forgejo runner has a separate leaf for host-mode jobs, and its rootless Podman socket service has another. The runner depends on the Podman socket and on emma-cgroup-layout. Having the socket daemon in the right group is not proof that a container process lands there; descendant placement needs to be checked during a real container job.
From /sys/fs/cgroup to Grafana
A second Python helper reads each parent group's memory.current, memory.swap.current, cpu.stat, memory.events and io.stat. Parent counters include their descendant leaves. Guix installs an mcron job that runs the collector every minute and atomically replaces a .prom file in node exporter's textfile directory:
(define %emma-workload-job
  #~(job '(next-minute (range 0 60))
         (string-append
          #$(file-append python "/bin/python3") " "
          #$(local-file "workload_metrics.py")
          " --output /var/lib/prometheus/node-exporter/emma-workloads.prom"
          " --group ci-builds=emma/ci-builds"
          " --budget ci-builds=11,4"
          " --group emma-runner=emma/emma-runner"
          " --budget emma-runner=2,1")))
The budget pairs mean GiB and CPU cores. The collector exports emma_workload_budget_memory_bytes and emma_workload_budget_cpu_cores as reference gauges, alongside measured memory, swap, CPU time, throttling, OOM events and I/O bytes. It also emits emma_workload_present and a collection timestamp. An incomplete or missing group gets present=0 without invented usage samples. Node exporter exposes the textfile, Prometheus scrapes it, and Grafana reads Prometheus; Grafana does not create or enforce any quota. This follows node exporter's textfile-collector pattern.
I use the existing Emma Capacity & Budgets dashboard. Here are its two workload panels from a live, two-hour Grafana view on 9 October 2026. The screenshot shows the ci-builds CPU curve crossing its four-core planning line. That is an observation, not throttling or evidence that a quota has been applied. The capture predates the completed 24-hour review.
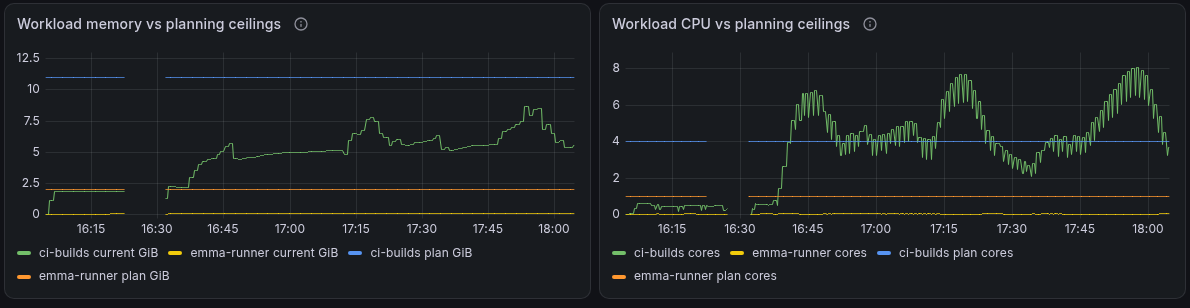
The memory panel plots actual usage and the planning line for each workload:
emma_workload_memory_bytes{machine="emma",workload=~"ci-builds|emma-runner"} / 1024^3
emma_workload_budget_memory_bytes{machine="emma",workload=~"ci-builds|emma-runner"} / 1024^3
The CPU panel uses a five-minute rate against the core budget:
rate(emma_workload_cpu_seconds_total{machine="emma",workload=~"ci-builds|emma-runner"}[5m])
emma_workload_budget_cpu_cores{machine="emma",workload=~"ci-builds|emma-runner"}
Those are two Grafana queries per time-series panel, not a command that installs limits. I keep the host's available memory, root disk space, CPU execution versus I/O wait and OOM/swap activity alongside them. The coverage stat reads emma_workload_present; a missing series is No data, not zero usage. The dashboard was designed before the exporter existed and still contains some "proposed / not yet verified" explanatory text. Some per-workload curves are now live, but that text should only be revised once completed jobs and descendants have been checked. Until then, a pretty plot is not proof of correct attribution.
Rollout, not just reconfigure
I tested the layout and launch ordering in a disposable, network-disabled Guix VM. A read-only-store VM was enough to check placement but could not run an actual Cuirass register that wrote to the store, so I repeated that check with a guest-owned writable QCOW2 store. Both real Cuirass daemons then ran as cuirass in the intended leaf. That still was not a representative online build.
For Emma itself, I reviewed the channel and system changes on separate Git branches, ran the service regression check and guix system shepherd-graph, and dry-ran the system build. A full build on Emma used one build job and one core after an earlier attempt ran into memory pressure. Only then did an operator reconfigure the host and, later, perform a normal reboot with the previous generation available at the console. After restarting the affected services, I checked actual PIDs in /proc/<pid>/cgroup, the collector file and successive healthy Prometheus scrapes. The post-boot 24-hour observation began on 9 October 2026 at 14:39 UTC, after those checks.
That reboot exposed a separate loose end: Cuirass, the runner, its Podman socket, git-pages and node exporter did not all start unattended. We brought them up manually. A Tailscale-address race might explain some listeners, but it does not explain every stopped CI service; the boot logs still need investigation. Manual recovery is not a successful boot test.
The next pass is to match the curves against completed Cuirass builds and Forgejo jobs (including container descendants), inspect the same-window service logs and compare job duration with a baseline. The shared Guix daemon's counters measure all its clients, not just Cuirass. Until that work is done, I have a useful accounting experiment and a rollback path, not a safe quota recommendation.
The Guix system manual covers generations and reconfiguration; the kernel cgroup-v2 documentation explains the counter and control files. Grafana's visualization documentation covers building panels from Prometheus queries.