Emacs Debugging with Dape

Categories: programming
Tags: emacs
For reasons I keep a set of machines where I regularly work on in sync so they offer a familiar environment. This includes a dual boot desktop (Ubuntu/Windows+WSL), laptop (Arch/Windows+WSL), a VPS(Arch) doing stuff, a virtual Ubuntu thing which is always running to monitor stuff on my NAS, and a Steam deck (Arch kinda). I expect these to be familiar environments so I can do some light development and scripting on them at least.
Test plan
In order to test the debugging support we need some minimum set of requirements to avoid descending in the abyss of incremental details.
To evaluate the configuration for a language we need
- a simple project in order not to be debugging the build system or the code itself taking more time than setting up the debugging. DAP is plenty complicated on its own.
- The DAP adapter installed with minimal manual work because otherwise it wont get done and there will be too much variance/rework between systems
- A set of familiar keybindings
My requirements are:
- I can run the program in the debugger
- I can pass command line arguments to the script
- I can break the program on a line in the editor
- I can examine variables in scope when the breakpoint is hit
- I can see the output of the program
- I can quit/restart and there should not be leaking of processes/network ports/buffers. I.e. I can get back to editing and debugging without rebooting my PC.
- (I would like to pass environment variables too, but since apparently direnv works fine for my purposes I hardly ever use it anymore, so keep that on the backburner for now.)
I do not really use debugging for something else. I actually seldom use the debugger. Mostly for learning new programming languages or playing with libraries concepts. If things get hairy I return back to logging/println debugging anyway (or adding more tests to herd the bugs in a small area).
My test procedure is as follows.
- open the source code
- place a breakpoint early in the program after some variables are set
<leader>ddto start the debugger- curse on the dape prompt to select the program and pass arguments, set the cwd and more of that fun.
- check if the breakpoint is hit
- examine the variables
- continue to see the program continue with
<leader>dc - quit the program with
<leader>dq - verify we are back in our familiar editing session
- do a quick
ps axto see if we do not have unwanted critters still crawling around the process space.
It is far from a comprehensive test, but we are testing here if the DAP adapter is properly installed and behaving as expected in my environment, not a validation test of the adapter itself.
Javascript/Typescript example
I assume that if I can debug typescript, I can debug javascript. So I created a little typescript program to calculate the answer to the meaning of life, the universe and everything.
But first installing the DAP adapter. It is a bit fiddly and I do not want to repeat that on all my systems so I let emacs to the heavy lifting. It are just the instructions from the dape repo:
(setq snam-vscode-js-debug-dir (file-name-concat user-emacs-directory "dape/vscode-js-debug"))
(defun snam-install-vscode-js-debug ()
  "Run installation procedure to install JS debugging support"
  (interactive)
  (mkdir snam-vscode-js-debug-dir t)
  (let ((default-directory (expand-file-name snam-vscode-js-debug-dir)))

    (vc-git-clone "https://github.com/microsoft/vscode-js-debug.git" "." nil)
    (message "git repository created")
    (call-process "npm" nil "*snam-install*" t "install")
    (message "npm dependencies installed")
    (call-process "npx" nil "*snam-install*" t "gulp" "dapDebugServer")
    (message "vscode-js-debug installed")))
Then add the dap config for the javascript and typescript modes:
            (add-to-list 'dape-configs
                         `(vscode-js-node
                           modes (js-mode js-ts-mode typescript-mode typescript-ts-mode)
                           host "localhost"
                           port 8123
                           command "node"
                           command-cwd ,(file-name-concat snam-vscode-js-debug-dir "dist")
                           command-args ("src/dapDebugServer.js" "8123")
                           :type "pwa-node"
                           :request "launch"
                           :cwd dape-cwd-fn
                           :program dape-find-file-buffer-default
                           :outputCapture "console"
                           :sourceMapRenames t
                           :pauseForSourceMap nil
                           :enableContentValidation t
                           :autoAttachChildProcesses t
                           :console "internalConsole"
                           :killBehavior "forceful"))
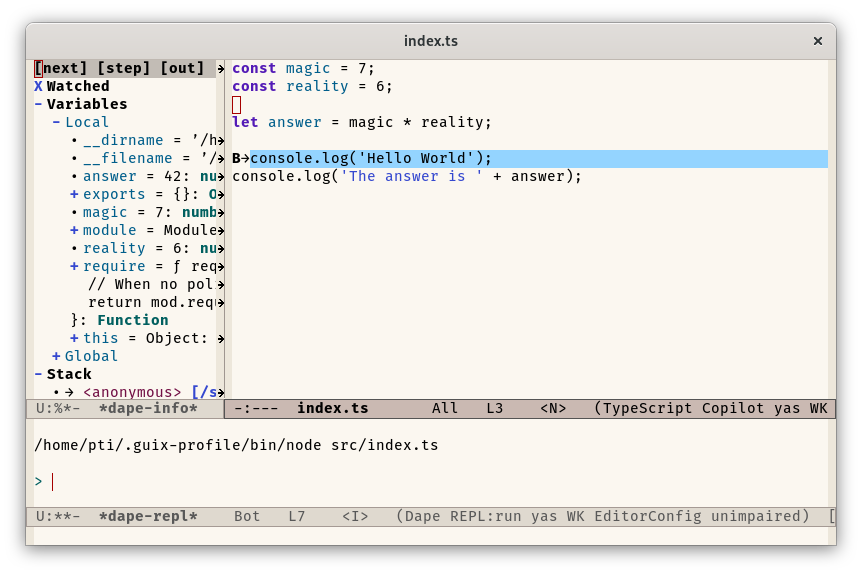
The debugging our little app. Answer at the prompt:
vscode-js-node :program "src/main.ts"
and the debug view opens:
Python example
As indicated on the dape repo install the python DAP adapter
$ pip install debugpy
Add the default settings to dape-configs
            (add-to-list 'dape-configs
                         `(debugpy
                           modes (python-ts-mode python-mode)
                           command "c:/Python312/python.exe"
                           command-args ("-m" "debugpy.adapter")
                           :type "executable"
                           :request "launch"
                           :cwd dape-cwd-fn
                           :program dape-find-file-buffer-default))
and update the command to wherever python is installed. This is from my windows machine which succeeded again to lose its default python config so I have to coerce it a bit to find it.
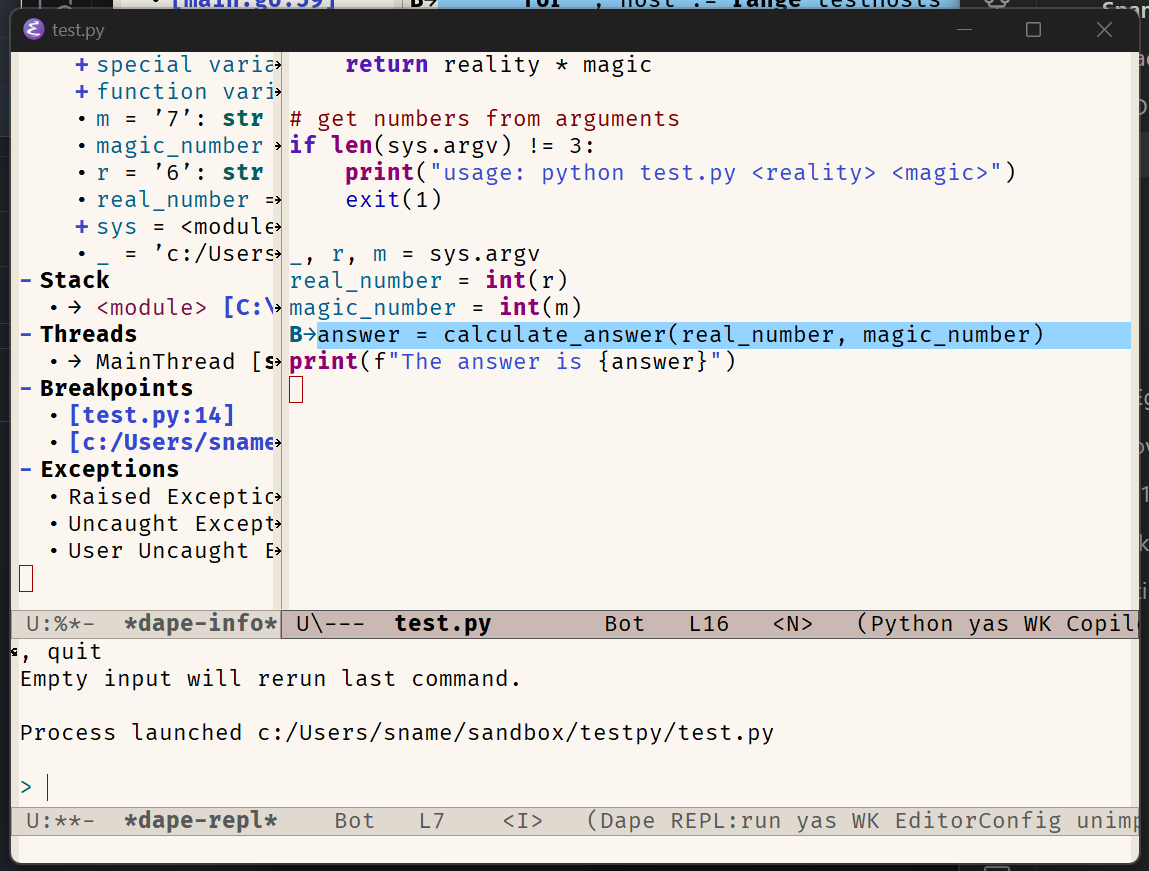
Open a python file, and start the debugger. On the Dape config: prompt enter:
debugpy :args ["6" "7"]
There are many more parameters, but dape will ask the missing ones with the functions in the configuration, here dapy-cwd-fn to fill in the current working directory (usually the project root) in the :cwd field and dape-find-file-buffer-default will propose the open file to run as the program to debug.
It cannot meaningfully guess which parameters I want to pass so I add manually the :attr field with the values "6" and "7" in a vector. Do not use a list for that as that is not properly encoded by the json converter.
It asks to confirm the program and opens the debugging views:
Go Example
Installing the go adapter is just installing delve with your favorite package manager. If your package manager does not help (looking at you, chocolatey):
go install github.com/go-delve/delve/cmd/dlv@latest
I did not bother to emacsify this as it is completely different for all my systems and I probably revisit that some time if I have a good idea to somehow abstract the differences away.
Adding the config to dape-configs:
            (add-to-list 'dape-configs
                         `(delve
                           modes (go-mode go-ts-mode)
                           command "dlv"
                           command-args ("dap" "--listen" "127.0.0.1:55878")
                           command-cwd dape-cwd-fn
                           host "127.0.0.1"
                           port 55878
                           :type "debug"       ;; needed to set the adapterID correctly as a string type
                           :request "launch"
                           :cwd dape-cwd-fn
                           :program dape-cwd-fn))
see debugging tips for an experience report (I made some typo while copy pasting... ). I used it to illustrate how I got around installation hickups.
Rust Example
Similar to Typescript I assume that if I can debug Rust, I should be able to debug C/C++ (which I try to avoid as much as possible).
I automated the installation of the DAP adapter for LLD
(setq snam-codelldb-dir (file-name-concat user-emacs-directory "dape/codelldb"))
(defun snam-install-codelldb ()
  "Install Vadimcn.Vscode-Lldb DAP server for C/C++/RUST"
  (interactive)
  (let* ((default-directory snam-codelldb-dir)
         (arch (car (split-string system-configuration "-" nil nil)))
         (os (pcase system-type
               (='windows-nt "windows")
               (='gnu/linux "linux")
               (='darwin "darwin")
               ('_ "unknown")))
         (version "1.10.0")
         (release-url (concat "https://github.com/vadimcn/codelldb/releases/download/v" version "/codelldb-" arch "-" os ".vsix")))
    (mkdir default-directory t)
    (url-copy-file release-url "codelldb.zip" t)
    (message "codelldb archive downloaded")
    (call-process "unzip" nil "*snam-install*" t "codelldb.zip")
    (message "codelldb installed")
    ))
Again this is just the installation instructions from the dape repo in emacs lisp.
adding the default config:
            (add-to-list 'dape-configs
                         `(codelldb
                           modes (c-mode c-ts-mode
                                         c++-mode c++-ts-mode
                                         rust-ts-mode rust-mode)
                           ;; Replace vadimcn.vscode-lldb with the vsix directory you just extracted
                           command ,(expand-file-name
                                     (file-name-concat
                                      snam-codelldb-dir
                                      (concat "extension/adapter/codelldb"
                                              (if (eq system-type 'windows-nt)
                                                  ".exe"
                                                ""))))
                           host "localhost"
                           port 5818
                           command-args ("--port" "5818")
                           :type "lldb"
                           :request "launch"
                           :cwd dape-cwd-fn
                           :program dape-find-file))
Since here the DAP is a binary I have to finagle the Windows file extension to make it work.
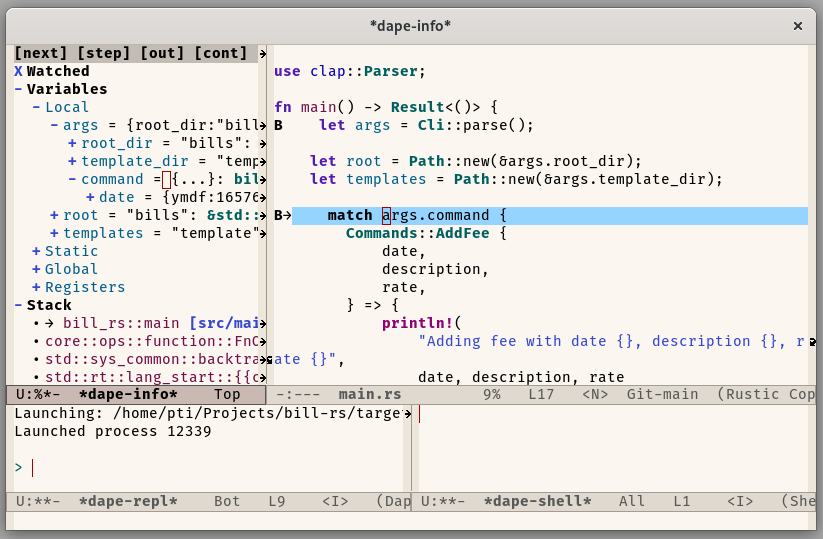
Then opening a rust binary, here src/main.rs, setting a breakpoint and launching the debugger.
I answered on the prompt
codelldb :args ["on"]
to specify the arguments for the program to be debugged.
Dape sees that the program is not specified so it asks for it and with tab completion tar<TAB>deb<TAB>bil<TAB> this is quickly selected and I am greeted with:
Debugging Tips
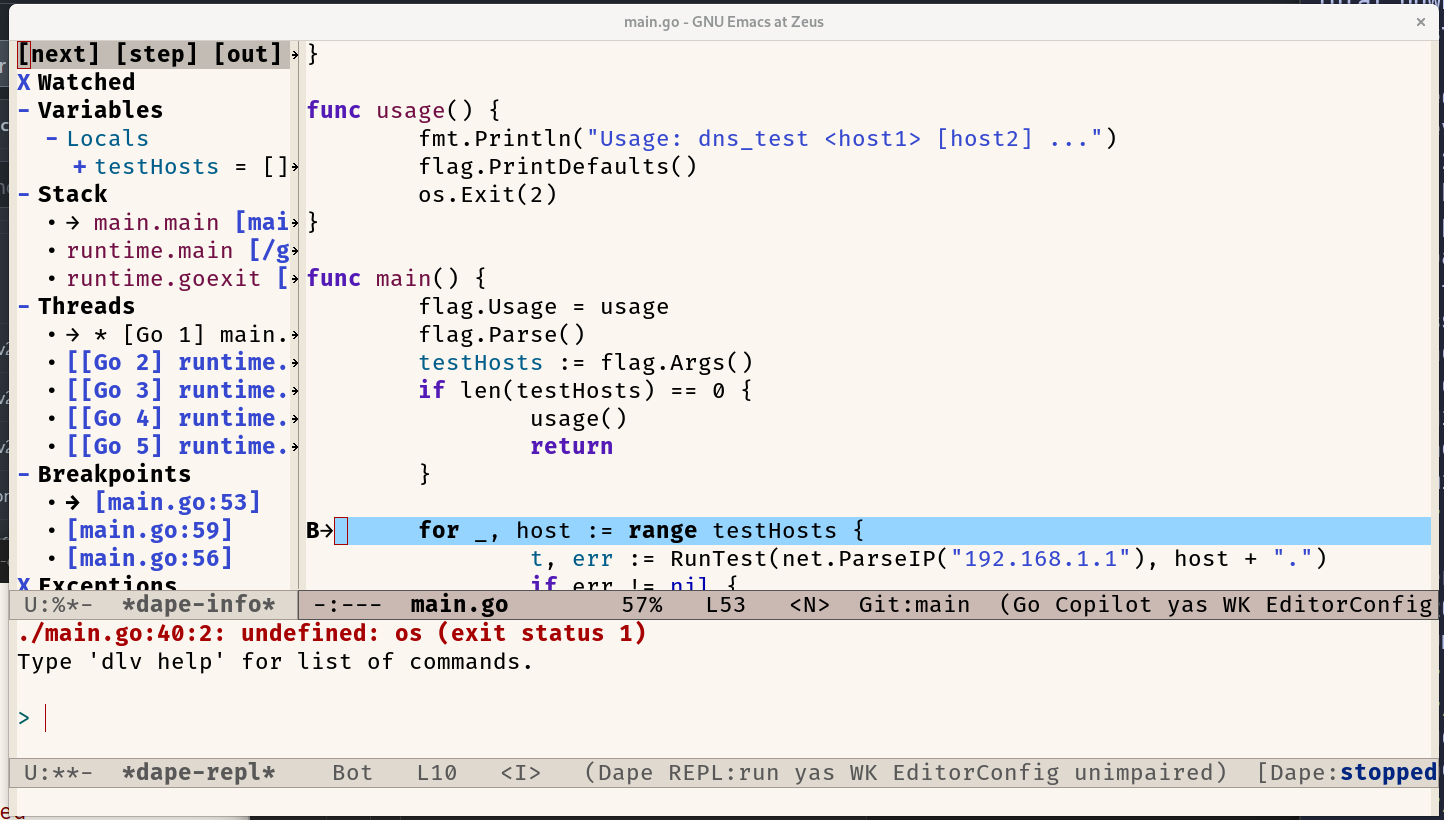
When trying the Go example I hit a snag : the debugger started but no active thread was present.
First stop is to open *dape_debug* buffer :
[info] Starting new multi session
[info] Server process started ("dlv" "dap" "--listen" "127.0.0.1:55878")
[info]
Process ("dlv" "dap" "--listen" "127.0.0.1:55878") exited with 1
[info] Connection to server established 127.0.0.1:55878
[io] Sending:
(:arguments
 (:clientID "dape" :adapterID nil :pathFormat "path" :linesStartAt1 t :columnsStartAt1 t :supportsRunInTerminalRequest t :supportsProgressReporting t :supportsStartDebuggingRequest t)
 :type "request" :command "initialize" :seq 1)

[info]
Process nil exited with 256
[error] Timeout for reached for seq 1
So the process immediately exits, but we see no output. It would be nice to get that in the buffer, but it isn't...
Let's steal the command and run it in a terminal :
Zeus :: ~ % dlv dap --listen 127.0.0.1:55878                                                                      >>>
DAP server listening at: 127.0.0.1:55878
Now restart the debugger by quitting the debug session and starting a fresh one (we cannot use the restart command as the adapter is not running, we need to restart the adapter not the debugged program).
Zeus :: ~ % dlv dap --listen 127.0.0.1:55878                                                                      >>>
DAP server listening at: 127.0.0.1:55878
2023-10-20T18:13:02+02:00 error layer=dap DAP error: json: cannot unmarshal bool into Go struct field InitializeRequestArguments.arguments.adapterID of type string
Zeus :: ~ %
Ok, the typechecker got a bool where it expected a string. Opening dape.el and searching for json-serialize we find the location.
(defun dape-send-object (process seq object)
  "Helper for `dape-request' to send SEQ request with OBJECT to PROCESS."
  (let* ((object (plist-put object :seq seq))
         (json (json-serialize object :false-object nil))
         (string (format "Content-Length: %d\r\n\r\n%s" (length json) json)))
    (dape--debug 'io "Sending:\n%s" (pp-to-string object))
    (process-send-string process string)))
Let's print out the JSON we're sending :
(defun dape-send-object (process seq object)
  "Helper for `dape-request' to send SEQ request with OBJECT to PROCESS."
  (let* ((object (plist-put object :seq seq))
         (json (json-serialize object :false-object nil))
         (string (format "Content-Length: %d\r\n\r\n%s" (length json) json)))
    (dape--debug 'io "Sending:\n%s" (pp-to-string object))
    (dape--debug 'io "Sending JSON:\n%s" json)
    (process-send-string process string)))
this gives
(:arguments
 (:clientID "dape" :adapterID nil :pathFormat "path" :linesStartAt1 t :columnsStartAt1 t :supportsRunInTerminalRequest t :supportsProgressReporting t :supportsStartDebuggingRequest t)
 :type "request" :command "initialize" :seq 1)

[io] Sending JSON:
{"arguments":{"clientID":"dape","adapterID":false,"pathFormat":"path","linesStartAt1":true,"columnsStartAt1":true,"supportsRunInTerminalRequest":true,"supportsProgressReporting":true,"supportsStartDebuggingRequest":true},"type":"request","command":"initialize","seq":1}
[info]
The supportsXXX things look to be bools, but the adapterID feels funny to be a bool... Where does this come from?
(defun dape--initialize (process)
  "Send initialize request to PROCESS."
  (dape-request process
                "initialize"
                (list :clientID "dape"
                      :adapterID (plist-get dape--config
                                            :type)
                      :pathFormat "path"
                      :linesStartAt1 t
                      :columnsStartAt1 t
                      ;;:locale "en-US"
                      ;;:supportsVariableType t
                      ;;:supportsVariablePaging t
                      :supportsRunInTerminalRequest t
                      ;;:supportsMemoryReferences t
                      ;;:supportsInvalidatedEvent t
                      ;;:supportsMemoryEvent t
                      ;;:supportsArgsCanBeInterpretedByShell t
                      :supportsProgressReporting t
                      :supportsStartDebuggingRequest t
                      ;;:supportsVariableType t
                      )
...
Ok, it comes from the config :type attribute... What do I have in my config???
            (add-to-list 'dape-configs
                         `(delve
                           modes (go-mode go-ts-mode)
                           command "dlv"
                           command-args ("dap" "--listen" "127.0.0.1:55878")
                           command-cwd dape-cwd-fn
                           host "127.0.0.1"
                           port 55878
                           dape "debug"
                           :request "launch"
                           :cwd dape-cwd-fn
                           :program dape-cwd-fn))
Hmm... what is that dape attribute. In all other configs there is a :type in that place. That seems a slip of the finger triggering an unlucky evil command. (I checked on the repo and it was correct there so it was my fault). Let's change it to :type and C-x C-e the add-to-list expression to update the default config.
Let's try again :
Ok, now we're cookin' with fire!!!